 |
United States Department of Agriculture - Agricultural Research Service |  |
| Northwest Irrigation & Soils Research Lab, Kimberly, ID | ||
Irrigation Increases Carbon in Agricultural Soils |
 |
United States Department of Agriculture - Agricultural Research Service |  |
| Northwest Irrigation & Soils Research Lab, Kimberly, ID | ||
Irrigation Increases Carbon in Agricultural Soils |
1USDA, Agricultural Research Service, Northwest Irrigation and Soils Research Laboratory, Kimberly, ID 83341
2University of Idaho, Research and Extension Center, Twin Falls, ID 83303-1827
Abstract
Carbon (C) reactions are among the most important chemical reactions that occur in irrigated soils and may contribute to the total amount of C sequestered in those soils. We measured inorganic and organic C stored in southern Idaho soils having long term land use histories that supported native sagebrush vegetation (NSB), irrigated moldboard plowed crops (IMP), irrigated conservation (chisel) tilled crops (ICT) and irrigated pasture systems (IP). Inorganic C and total (inorganic + organic) C in soil decreased in the order IMP>ICT>IP>NSB. If irrigated land were expanded by 10% worldwide and NSB were converted to IMP, a possible 1.60 x 10⁹ Mg inorganic C (2.78% of the total C emitted in the next 30 yr) could be sequestered in soil. If irrigated land were expanded by 10% worldwide and NSB were converted to ICT, a possible 1.10 x 10⁹ Mg inorganic C (1.87% of the total C emitted in the next 30 yr) could be sequestered in soil. If irrigated land were expanded worldwide and NSB were converted to IP a possible gain of 2.6 x 10⁸ Mg inorganic C (0.04% of the total C emitted in the next 30 yr) could be sequestered in soils. Inorganic C sequestered from land use changes have little potential to make a significant impact on concentration of atmospheric CO2. When coupled with organic C and altering land use to produce crops on high output irrigated agriculture, while selected less-productive rainfed agricultural land were returned to temperate forest or native grassland, there could be reductions in atmospheric CO2.Introduction
Calcium content of arid and semi-arid region soils is usually elevated compared to temperate regions due to calcium rich parent material and low rainfall. Carbonate formation is usually controlled by equilibrium reactions in the solid phase carbonate and gas phase CO2 (CO2o). Respiratory processes that occur in plant roots and soil microorganisms continually produce CO2 increasing its concentration in the soil atmosphere, modifying the solubility relationships of carbonate formation and many plant nutrients. Increasing the CO2o dissolved in water by 10 fold increases the rate of carbonate formation by 10 fold. The solubility of CO2o in water is highly temperature dependant. Increased water temperatures will increase reaction time and, in favorable conditions, increase CaCO3 precipitation. The pH of irrigation water can increase as it flows through irrigation canal systems and agricultural fields by dissolving cations as it comes in contact with basic soils. The activity of H2CO3 increases 10 fold for each unit increase in pH, whereas the activity of the CO2 increases 100 fold for each unit increase. When irrigation water having high concentrations of Ca, dissolved H2CO3, CO2o, a high pH value, and an elevated temperature is applied to soil, CaCO3 often precipitates. The objective of this research was to determine if land managed as irrigated moldboard plowed crops, irrigated conservation tillage, or irrigated pasture would increase the amount of inorganic C in soil compared to native sagebrush vegetation. We use our findings to determine the influence of inorganic C on total (organic + inorganic) C of altered land management polices that could favor global C sequestration.Materials and Methods
The study area is located on the Snake River Plain, between 42o 30' 00" and 43o 30' 00" N. and 114o 20' 00" and 116o 30' 00" W. The area is classified as a temperate semi-desert ecosystem. The experiment was arranged in a completely randomized design. Soil samples were taken from three sites supporting native sagebrush vegetation (NSB), three irrigated sites maintained as pasture (IP), three irrigated conservation tillage sites (ICT) for the past 8 years, and three irrigated moldboard plowing systems (IMP). We sampled the top 1 m of soil. Ten randomly chosen 2.4 cm diameter replicate cores were randomly taken and partitioned into 0-5 cm, 5-15 cm, 15-30 and 30-100 cm depths. Roots greater than 1.0 cm diameter were measured separately. Inorganic C in each sample of mineral soil was determined by titration (Loeppert and Suarez 1996). Concentration of organic C in each sample of mineral soil was determined by the Walkley-Black procedure (Nelson and Sommers 1996). The amount of C ha-1 of the 0-100 cm of mineral soil was calculated assuming 0.44 g C g-1 organic matter with correction for soil bulk density. We estimated C storage in soils locally, regionally, and worldwide, if all and presently managed as IMP was converted to ICT, and if 10% of land managed as IMP was converted to IP.Results
Initial organic C in soils was greater in the IP treatment than the other vegetation types (Table 1). Inorganic and total (organic + inorganic) C was higher in soils supporting IMP, ICT and IP vegetation than soils with NSB vegetation. Crops were not considered as permanent vegetation and thus assigned a value of 0. Net inorganic and total C on the soils decreased in the order IMP>ICT>IP>NSB.
Using these values to represent inorganic C gain or loss for all irrigated crop land in the Pacific Northwest U.S., western U.S. and worldwide, if irrigated land were expanded by 10% and NSB were converted to IMP, a possible 1.60 x 10⁹ Mg inorganic C (2.78% of the total C emitted in the next 30 yr) could be sequestered in soil. If irrigated land were expanded by 10% and NSB were converted to ICT, a possible 1.10 x 10⁹ Mg inorganic C (1.87% of the total C emitted in the next 30 yr) could be sequestered in soil. If irrigated land were expanded and NSB were converted to IP a possible gain of 2.6 x 10⁸ Mg inorganic C (0.04% of the total C emitted in the next 30 yr) could be sequestered in soils.
Using these values to represent C gains for all irrigated crop land in the Pacific Northwest U.S., western U.S. and worldwide, if land irrigated agriculture were expanded by 10% and NSB were converted to IMP, a possible 1.6 x 10⁹ Mg C (2.72% of the total C emitted in the next 30 yr) could be sequestered in irrigated agricultural soils (Table 2). If irrigated land were expanded by 10% and NSB were converted to ICT a possible 1.3 x 10⁹ Mg C (2.24% of the total C emitted in the next 30 yr) could be sequestered. If irrigated land were expanded by 10% and NSB were converted to IP a possible 1.7 x 10⁸ Mg C (1.17% of the total C emitted in the next 30 yr) could be sequestered. Irrigated land typically produces twice the crop yield of rainfed agricultural land (Bucks and others 1990, Tribe 1994, Howell 2000). If irrigated land were expanded 10%, each hectare of new irrigated land could produce the same crop yield as 2 ha of rainfed land. If irrigated land were expanded and an equal amount of rainfed agricultural land were returned to native grassland in this 2:1 conversion scenario, there is a potential to sequester 2.8 x 10⁷ Mg C (0.05% of the total C emitted in the next 30 yr) in the Pacific Northwestern U.S., 7.4 x 10⁷ Mg C (0.13% of the total C emitted in the next 30 yr) in the western U.S. and 6.7 x 10⁸ Mg C (1.19% of the total C emitted in the next 30 yr) worldwide (Table 3).
Table 1. Inorganic and organic C in soils, aboveground biomass and on sites at present, C emitted during agricultural operations, net total C in soil and on site. |
||||||||
|
---- Carbon Present in Soil ----- |
---- Carbon Present ------ |
Carbon |
------ Net Carbon ------- |
||||
Vegetation |
Organic |
Inorganic |
Total |
Aboveground |
Site |
Emitted |
Soil |
Site |
|
------------------------------------------------------- kg C m2 ------------------------------------------------------------ |
|||||||
Native Sagebrush |
5.91c |
9.50c |
15.41c |
0.42a |
15.83c |
0.00d |
15.41c |
15.83c |
|
|
|
|
|
|
|
|
|
Irrigated Moldboard Plow Crop |
7.29b |
15.60a |
22.89a |
0.00c |
22.89a |
1.10a |
21.79a |
21.79a |
|
|
|
|
|
|
|
|
|
Irrigated Conservation Tilled Crops |
8.01b |
13.60a |
21.61a |
0.00c |
21.61a |
0.87b |
20.74a |
20.74a |
|
|
|
|
|
|
|
|
|
Irrigated Pasture |
10.14a |
8.50b |
18.64b |
0.05b |
18.69b |
0.29c |
18.35b |
18.40b |
a In each column, values followed by the same letter are not significantly different as determined by the least square means test (p ≤ 0.05; n = 16). |
||||||||
b Values of organic C are determined by the Walkley-Black procedure. |
||||||||
c Values of inorganic C are determined by titration. |
||||||||
d C in soils, aboveground vegetation and on the site at the present time. |
||||||||
e Estimated C emitted in production of fertilizer, fuel consumption in farm operations over a 30-year period. |
||||||||
Table 2. Total (organic and inorganic) C sequestered in soils by a 10% expansion of arid or semi-arid land to irrigated land. |
|||||||
Vegetation Conversion |
C gained from a 10% conversion |
Pacific Northwest United States |
Western United States |
Worldwide |
|||
|
Mg C ha-1 |
Mg C |
% Cs/CEW |
Mg C |
% Cs/CEW |
Mg C |
% Cs/CEW |
Native Sagebrush to Irrigated Moldboard Plow |
6.1 |
5.3 x 10⁷ |
0.10 |
1.5 x 10⁸ |
0.25 |
1.9 x 10⁹ |
2.72 |
|
|
|
|
|
|
|
|
Native Sagebrush to Irrigated Conservation Tillage |
4.9 |
4.4 x 10⁷ |
0.04 |
1.2 x 10⁸ |
0.20 |
1.3 x 10⁹ |
1.17 |
|
|
|
|
|
|
|
|
Native Sagebrush to Irrigated Pasture |
2.6 |
2.3 x 10⁷ |
0.04 |
6.3 x 10⁷ |
0.10 |
1.7 x 10⁸ |
1.17 |
a Land area in irrigated crop land in the Pacific Northwest is 9,055,979 ha, in the Western United States is 24,322,029 ha and worldwide is 260,000,000 ha. b % Cs/CEW = C sequestered (Cs) divided by the amount of C projected to be emitted worldwide during the next 30 years, which is 5.7 x 10¹⁰ Mg C (CEW) multiplied by 100. |
|||||||
Table 3. Potential C transfer by converting 10% of land currently in rainfed moldboard plow land to native forest and native grassland on a 1 unit to 1 unit basis and conversion of 10% of rainfed moldboard plow land to native forest and native grassland on a 2 unit to 1 unit basis. |
|||||||
|
|
|||||||
10% conversion of vegetation from rainfed land in moldboard plow |
|
Pacific Northwest United States |
Western United States |
Worldwide |
|||
|
Mg C ha-1 |
Mg C |
% Cs/CEW |
Mg C |
% Cs/CEW |
Mg C |
%Cs/CEW |
Rainfed Moldboard Plow to Native Forest on a 1 Unit to 1 Unit Basis |
0.56 |
5.1 x 10⁶ |
0.01 |
1.4 x 10⁷ |
0.02 |
1.5 x 10⁸ |
0.23 |
|
|
|
|
|
|
|
|
Rainfed Moldboard Plow to Native Grassland on a 1 Unit to 1 Unit Basis |
1.30 |
1.0 x 10⁷ |
0.02 |
2.8 x 10⁷ |
0.05 |
3.4 x 10⁸ |
0.59 |
|
|
|
|
|
|
|
|
Rainfed Moldboard Plow to Native Forest on a 2 Unit to 1 Unit Basis |
1.12 |
1.4 x 10⁷ |
0.03 |
3.9 x 10⁷ |
0.07 |
2.91 x 10⁸ |
0.51 |
|
|
|
|
|
|
|
|
Rainfed Moldboard Plow to Native Grassland on a 2 Unit to 1 Unit Basis |
2.60 |
2.8 x 10⁷ |
0.05 |
7.4 x 10⁷ |
0.13 |
6.7 x 10⁸ |
1.19 |
a % Cs/CEW = C sequestered (Cs) divided by the amount of C projected to be emitted worldwide during the next 30 years, which is 5.7 x 10¹⁰ Mg C (CEW) multiplied by 100. |
|||||||
b Irrigated agricultural land typically produces twice the yield as rainfed agriculture. |
|||||||
Soils in arid or semi-arid lands often contain substantially more inorganic than organic C. Inorganic C is present because there is insufficient precipitation to leach basic cations from the soil. Some of the basic cations form carbonates with CO3- sequestering C. When arid or semi-arid lands are initially converted to agriculture, basic cations may be leached from soil and CO2 may be emitted to the atmosphere by dissolution of carbonate minerals. If irrigation water contains a high concentration of basic cations, C may be sequestered by the reactions of elevated concentrations of CO2 in the soil atmosphere with Ca or Mg dissolved in the water.
Policy makers and agricultural research infrastructure should recognize the enormous potential benefit of land and water management strategies, polices and incentives that could expand arid zone irrigated agriculture as a means for efficient food and fiber production along with substantial C sequestration potential. This potential would be enhanced if coupled with selective return of less efficient rainfed agricultural lands derived from forest, grassland or wetlands back to native vegetation.
We recognize that the values for potential C gain in our study are estimates. To obtain a more precise value of potential C sequestration from management conversions on a regional basis it would be necessary to investigate the potential C accumulated in many different soils supporting many different vegetation types. The C trends that we monitored were the end result of management that predated new technology now available that would have prevented much of the erosion and loss of soil C on our monitored irrigation sites.
Blake, G.R. and K.H. Hartage. 1982. Bulk density. Pages 363-375 in A.L. Page, R.H. Miller, and D.R. Keeney (eds). Methods of soil analysis. Part 2, Chemical and Microbiological Properties. American Society of Agronomy, Madison, Wisconsin.
Bucks, D.A., T.W. Sammis, and G.L. Dickey. 1990. Irrigation for Arid Areas. Pages 449-548 in G.J. Hoffman, T.A. Howell and K.H. Solomon (eds). Management of Farm Irrigation Systems. American Society Agricultural Engineers, St. Joseph, Missouri.
Howell, T.A. 2000. Irrigations Role in Enhancing Eater Use Efficiency. Pages 67-80 in R.G. Evans, B.L. Benham and T.P. Trooien (eds). National Irrigation Symposium. American Society of Engineers, St. Joseph, MI.
Loeppert, R.H. and D.L. Suarez. 1996. Carbonate and Gypsum. Pages 437-474. in D.L.Sparks and others (eds). Methods of Soil Analysis. Part 3, Chemical Methods D.L. American Society of Agronomy, Madison, Wisconsin.
Nelson, D.W., and L.E. Sommers. 1996. Total Carbon, Organic Carbon and Organic Matter. Pages 961-1010 in J.M. Bigham (ed). Methods of Soil Analysis. Part 3, Chemical and Microbiological Properties. American Society of Agronomy, Madison, Wisconsin.
Tribe, D. 1994. Feeding and Greening the World, the Role of Agricultural Research. Page 274. CAB International, Wallingford, United Kingdom.
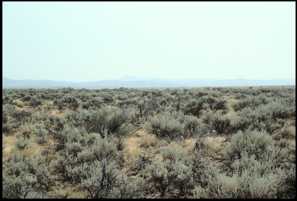 Click to view a bigger image. |
Photo 1. Large areas of native sagebrush in the intermountain west. |
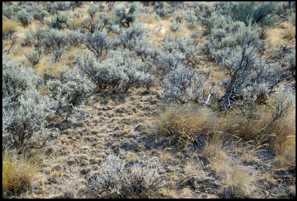 Click to view a bigger image. |
Photo 2. Native sagebrush showing large areas with little or no vegetation. |
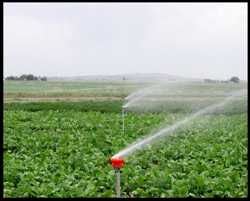 Click to view a bigger image. |
Photo 3. Large areas of irrigated agriculture in the intermountain west. |
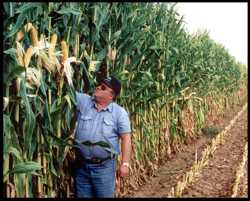 Click to view a bigger image. |
Photo 4. Irrigated corn showing large amounts of biomass; compare this to sagebrush in Photo 1. |
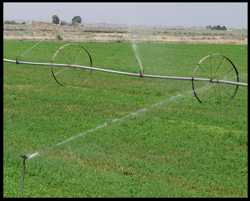 Click to view a bigger image. |
Photo 5. Irrigated land showing fast growing alfalfa (foreground) with slow growing, native sagebrush vegetation (background). |
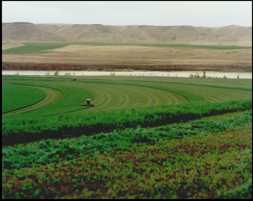 Click to view a bigger image. |
Photo 6. Harvesting irrigated alfalfa, (foreground) with slow growing sagebrush (background). |
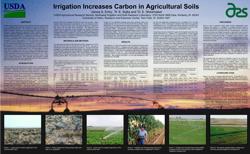
Click to view a bigger image of this poster.
*Disclaimer* Posters, by their nature, are preliminary findings. These data and their interpretation may be refined or changed before formal publication. We encourage the user to benefit from their early insight into our most recent research, but not to regard them as the "final word" on these findings.