| Res7Fig1-7 |

|
Figure 1. North Dakota state with country boundaries showing the NOAA AVHRR classified spring wheat areas with threelevels of percent spring wheat compositions estimated in each pixel.
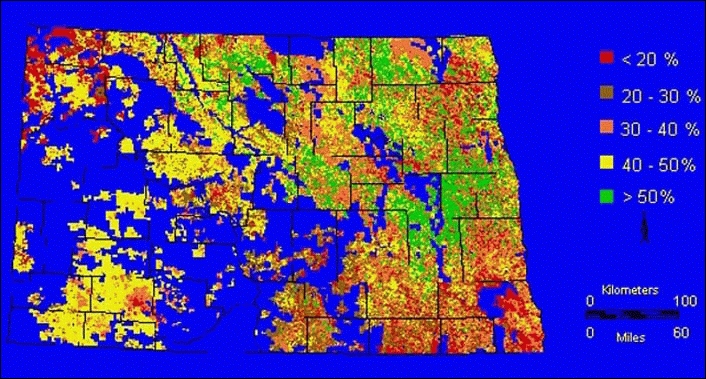
Figure 2. General soil association map for Richland, Ransom, and Sargent Counties. [0] Barnes-Buese; [3] Barnes-Hamerly; [4] Barnes-Svea; [5] Forman-Aastad; [7] Gardena-Glyndon; [9] Overly-Bearden; [13] Embden-Tiffany; [15] Hecla-Hamar; [18] Renshaw; [43] Fargo; [46] Bearden; [47] Glyndon; [52] Ulen-Hecla; [53] Ulen-Stirum; [58] Exline-Aberdeen; [73] Valentine-Hecla.
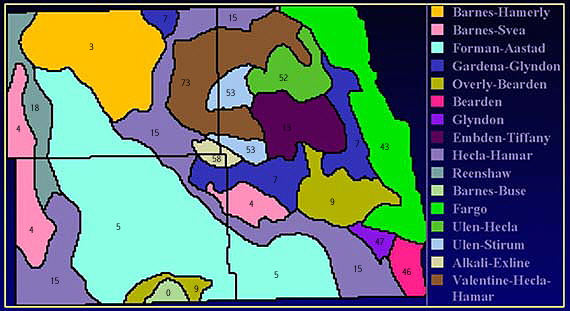
Figure 3. Landsat TM normalized difference vegetation index, for June 30, 1994 in southeastern North Dakota
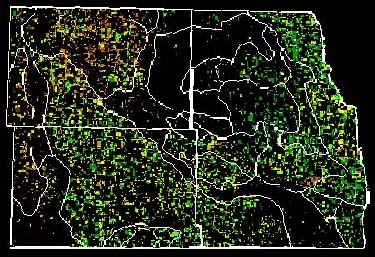
Figure 4. Schematic diagram of the crop simulation calibration with satellite data using a radiative transfer model
Figure 5. Simulated spring wheat yields (Bu/Ac) calibrated with Landsat TM for Richland, Ransom and Sargent counties.
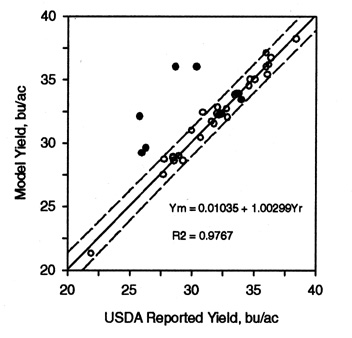
Figure 6. A comparison between simulated crop yields at sub-county level and integrated county yields with USDA/NASS reported yields.
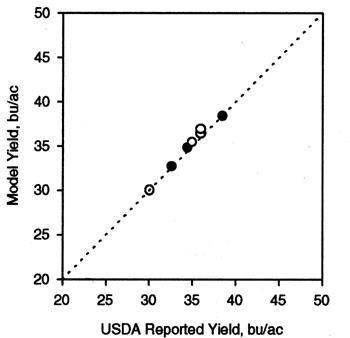
Figure 7. Simulation of spring wheat yields by counties in North Dakota for the 1994 season compared with the USDA/NASS report. The regression analyses produced an R