
ARS Home
» Northeast Area
» Beltsville, Maryland (BARC)
» Beltsville Agricultural Research Center
» Hydrology and Remote Sensing Laboratory
» Docs
» Crop Condition and Yield Research
» Res08
» Page 5
| Page 5 |

|
|
1 - Res08
2 - Page 2 3 - Page 3 4 - Page 4 5 - Page 5 6 - Page 6 7 - Page 7 8 - Page 8 9 - Page 9 10 - Page 10 11 - Page 11 |

Figure 5. North Dakota Spring Wheat County Yields (1989-1992) vs. AVHRR Sums of County |
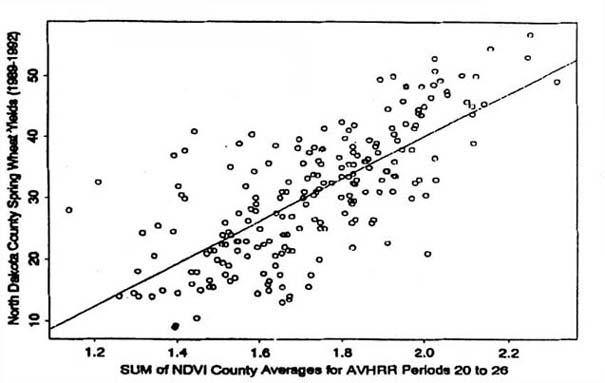 |
Figure 6. Plot of 1989 N. Dakota Spring Wheat Yields/ versus Latitude (Y) and Longitude (X)
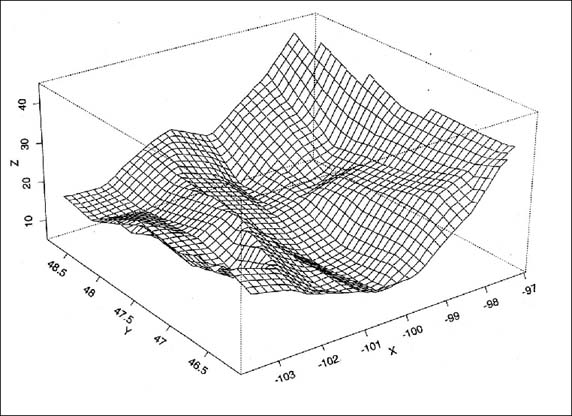
Figure 7. Plot of 1989 N. Dakota SUM.58 NDVI Values (Z) / versus Latitude (Y) and Longitude (X)
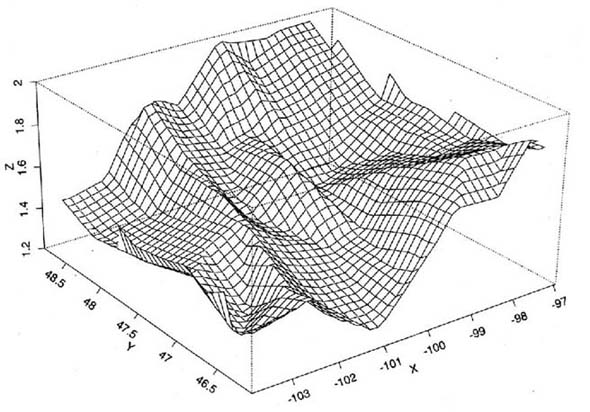
Figure 8. Plot of 1992 N. Dakota Spring Wheat Yields/ versus Latitude (Y) and Longitude (X)
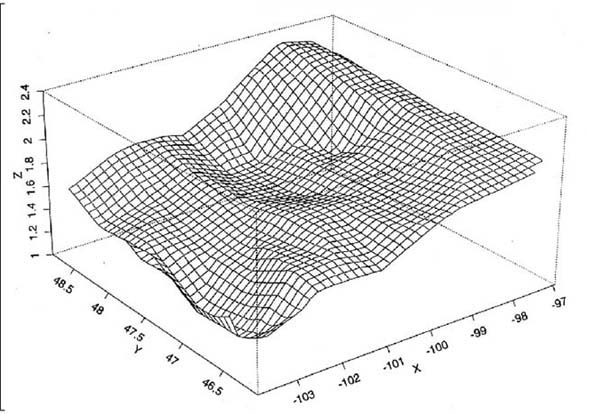
Figure 9. Plot of 1992 N. Dakota SUM.58 NDVI Values (Z) / versus Latitude (Y) and Longitude (X)

| << Previous 1 2 3 4 [5] 6 7 8 9 10 11 Next >> |