
| GRAPEX LAI |

|
Leaf Area Index (LAI) Measurements
LAI measurements are collected in grids adjacent to both flux towers, and in diagonal transects across the vineyards, during intensive observation periods (IOPs). LAI is measured throughout the growing season at the sap flow data vines. Locations are recorded using high-precision differential GPS.
LAI is collected using the LiCor LAI-2200 instrument.


Field observations of LAI are used to validate satellite retrievals. Sun et al. (2017) mapped LAI and Normalized Difference Vegetation Index (NDVI) over the vineyards using Landsat surface reflectance products. LAI was shown to be a good predictor of spatial yield variability, providing peak correlations of 0.8 at specific times during the growing season:
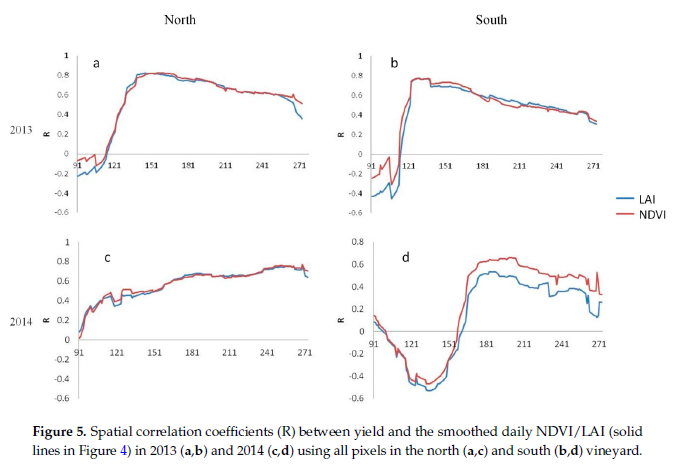
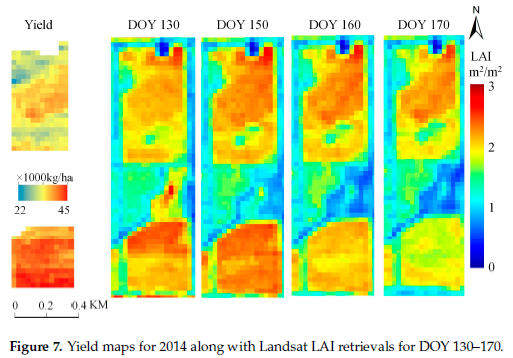
(Figures from Sun et al. 2017)