Image Number D3879-2 |
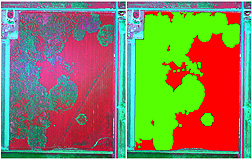
A color-infrared image (left) and the corresponding prescription map. On the prescription map, green represents treated areas, while red indicates areas that don’t need treatment.
Photo by Chenghai Yang, Lee Denham, and Fred Gomez.
Please visit our Image Gallery.

