 |
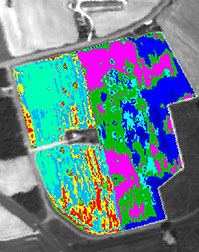
Images generated from data gathered from airplanes or satellites can give farmers detailed information about their crops. This farm on Maryland's eastern shore was scanned from an altitude of about a mile and a half in June 1998. Crop variability in the field of mature wheat at left of center shows as blue and pale-green areas, while yellow and red marks stands of weeds. In the field on the right, where new corn is just emerging, colors indicate variations in soil types and vegetative cover.
