| Current Weather Data |

|
Temperatures and Precipitation for 3/28/2025 - 04/03/2025
|
Fri |
Sat | Sun | Mon | Tue | Wed | Thu | |
| Low |
58 |
59 | 64 | 64 | 64 | 63 | 65 |
| High | 67 | 75 | 85 | 85 | 85 | 83 | 85 |
| Precip | 0.70 | 0.00 | 0.00 | 0.00 | 0.00 | 0.00 | 0.00 |
NOTE: The weather data displayed on this page is collected at the United States Department of Agriculture, Knipling-Bushland U. S. Livestock Insects Research Laboratory in Kerrville, Texas.
Precipitation amounts are for the 24 hour period ending at 8:00 AM on the day indicated.
Temperature and Rainfall data so far this month.
Summary for March 2025:
The total rainfall for the month was 1.68″, which is 0.41" below the 30 year average monthly rainfall of 2.09″.
The total rainfall for the year to date was 3.48″, which is 1.47″ below the 30 year average of 4.95″ for the year to date.
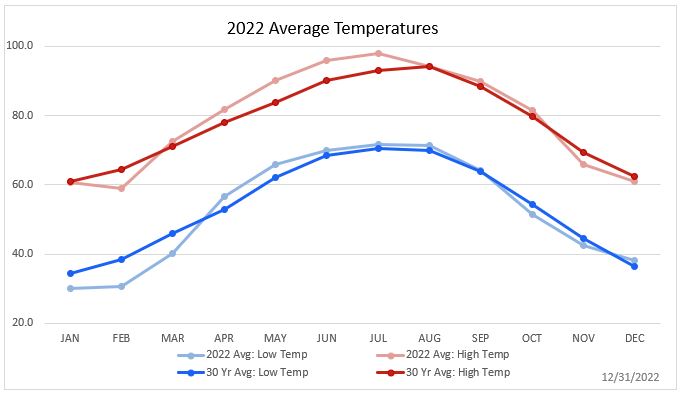
Temperatures averaged 63.4° which is 5.9° above the 30 year average of 57.5°.
The average high for the month was 78.2° which is 7.5° above the 30 year average of 70.7°.
The average low was 48.5°, which is 4.3° above the 30 year average of 44.2°.
High temperature recorded for the month was 92°, and low temperature for the month was 30°.
Temperature and Rainfall data for March
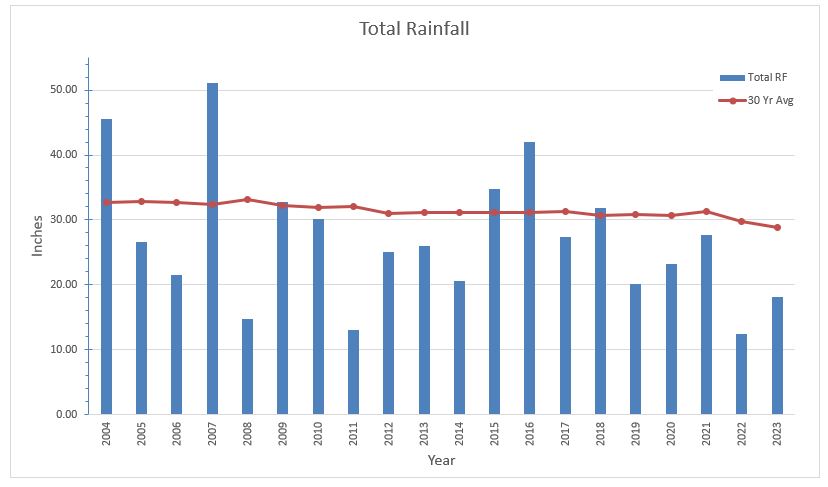
The first graph shows the year to date rainfall, the normal amount to date (30 year average).
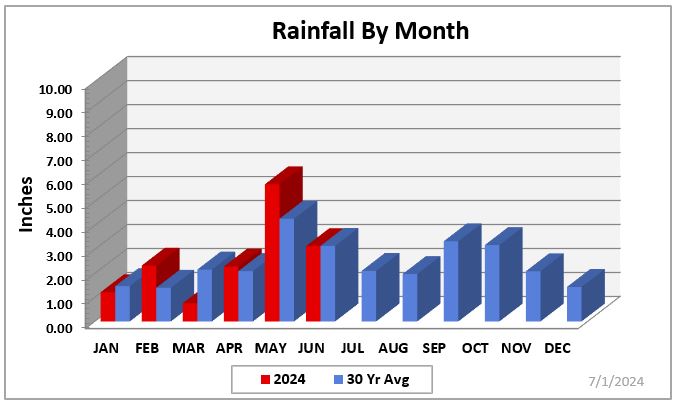
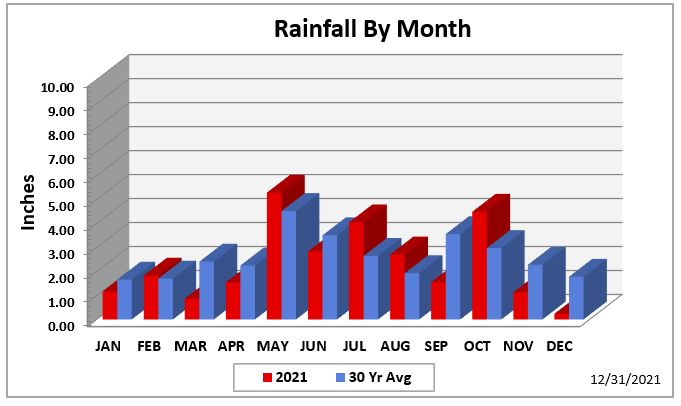
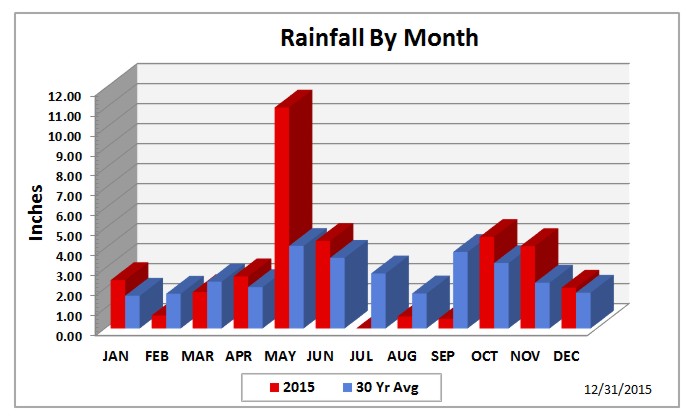
The second graph shows the rainfall for each month of the year in 2025 and the normal amount (30 year average) for each month.
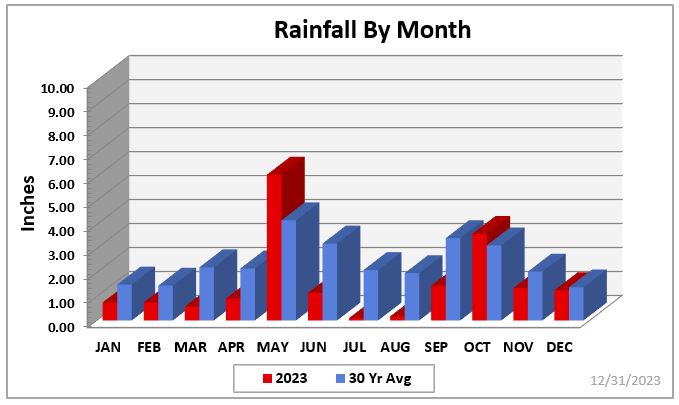
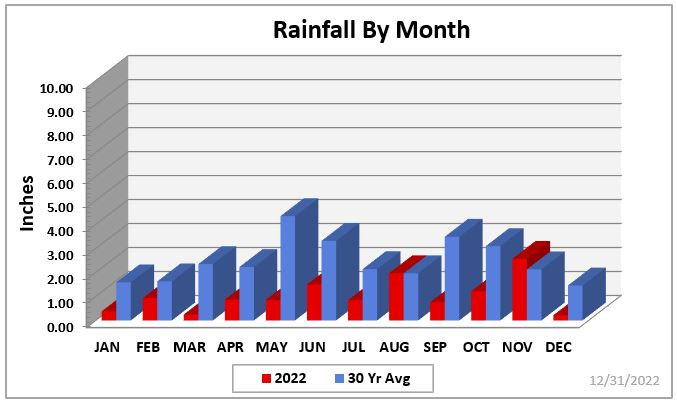
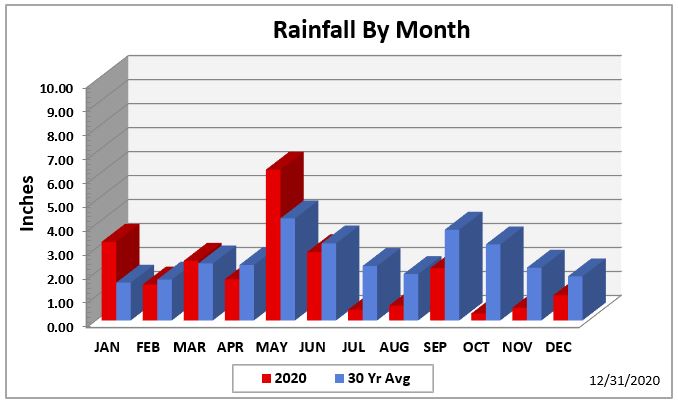
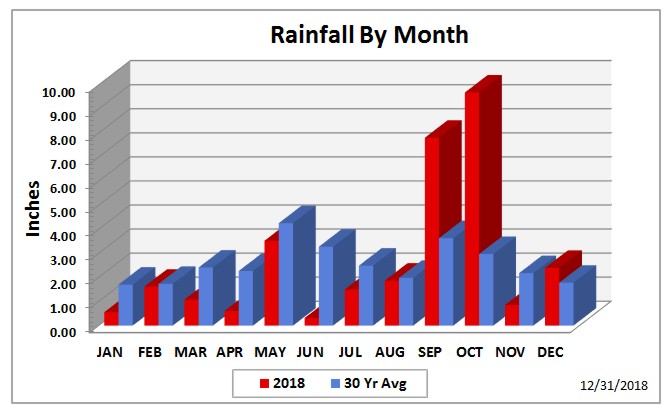
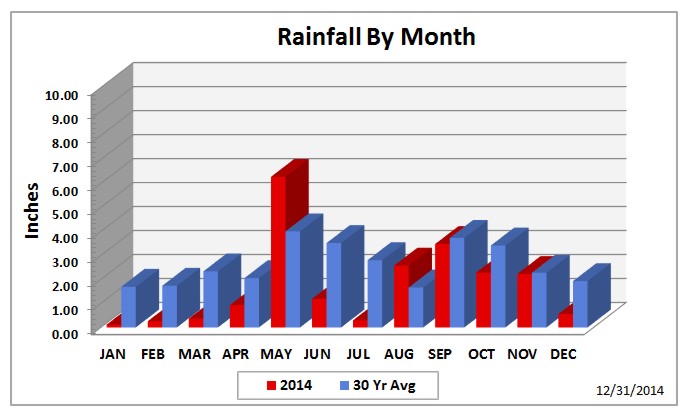
The remaining graphs show monthly rainfall and normals (30 year average) for previous years.
** Please note: The graphs which appear on this page are a visual representation of the weather data collected at KBUSLIRL. For specific rainfall data, please refer to the table above and/or the links to data made available on this site.