
![]()
Activity:
How Fertile Can You Get
![]()
|
Purpose:
|
To demonstrate the linear properties of flow rate in a Mariotte siphon or bottle. |
|
Materials:
|
wax orange juice container, nail, sand, *clay, and potting soil samples, two 2x4 pieces as in Figure 1, 20oz. plastic drink container, duct tape, water, container to catch water, graph paper, black waterproof marking pen, measuring cup |
|
Procedures:
|
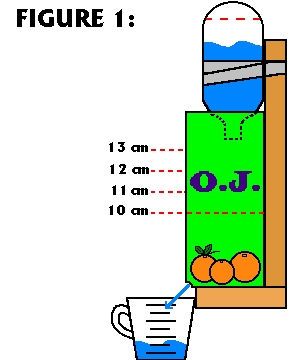
1. Cut the top off of the orange juice container so that the container is a rectangular cube. 2. Punch a small hole in the bottom corner of the wax container. Loosely place 10cm of soil sample in the orange juice container. 3. Make 3 more marks at one cm. graduations above the top of the soil. (11cm, 12cm, 13cm) 4. Set the container on the 2 x 4's as shown. |
|
|
|
5. Make a mark 1cm above the bottom of the 20oz. bottle. Fill the container with water. 6. Invert the 20oz. container directly over the top of the soil. 7. Begin timing when the water level reaches the mark on the bottle. 8. Stop timing when the water begins to exit the container at the bottom. Collect all of the water before continuing. Measure recoupment using a measuring cup. 9. Fill the 20oz. container again. Refill the soil sample to the 10 cm mark. 10. Invert the bottle over the soil at the 11cm mark. 11. Begin timing when the water level reaches the mark on the bottle. 12. Stop timing when the water begins to exit the container at the bottom. Collect all of the water before continuing. Measure recoupment using a measuring cup. 13. Repeat for the 13cm mark on the container. 14. Repeat the above 13 steps for the remaining soil samples. 15. Record observations in a table similar to the following.
16. Graph flow rate vs. head for all three soil samples. |
|
To Ponder...
|
1. What do the graphs tell you about the soil samples? 2. Why would this information be pertinent to farmers that need to apply fertilizer, water, etc. to fields? |