


- 1. RVF & El Niño Events
- 2. Historical Relationships
- a. Rift Valley Fever and the Southern Oscillation Index
- b. Rift Valley Fever and Sea Surface Temperatures
- c. Rift Valley fever, Rainfall, and the Normalized Difference Vegetation Index
- 3. Risk Monitoring, Mapping, and Prediction Model
- 4. RVF and All Climate Indicators
RVF & El Niño Events
RVF outbreaks are known to follow periods of anomalously high rainfall in Eastern Africa (Linthicum et al. 1983, 1984). Past studies indicate that periods of above-normal rainfall in equatorial eastern Africa are associated with warm El Niño Southern Oscillation (ENSO) events (Ropelewski and Halpert 1987, 1989). The ENSO phenomenon (Figs. 5-7) is now recognized as the principal cause of global interannual climate variability. The occurrence of this phenomenon results in shifts in precipitation patterns over the global tropics (Fig. 7). The Southern Oscillation Index (SOI) is the most commonly used index for the ENSO phenomenon (Glantz 1991; Chagas and Puppi 1986) and extends the history of ENSO back to the late 19th century.
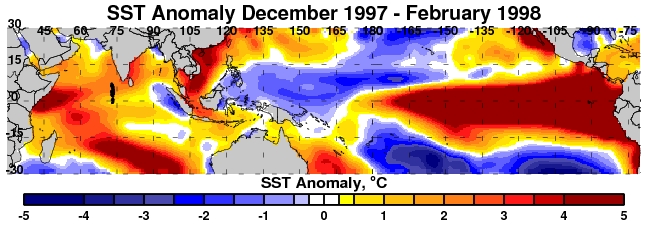
Figure 5. December 1997 — February 1998 sea surface temperature (SST) anomalies during the peak of the 1997/98 warm ENSO event.
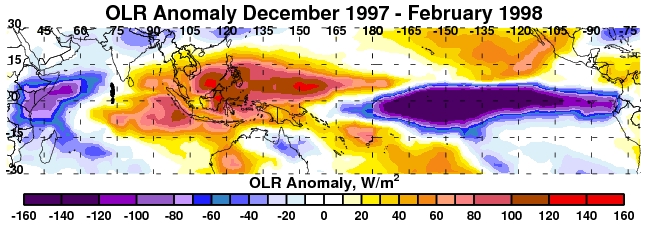
Figure 6. Outgoing longwave radiation (OLR) anomalies during December 1997 — February 1998, at the peak of the 1997/98 warm ENSO event.
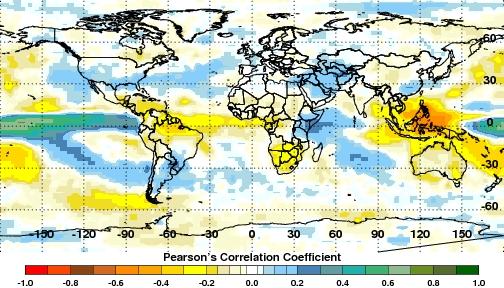
Figure 7. Summary correlation map between monthly NINO3.4 SST and rainfall anomalies, 1979 — 2008.
This index compares atmospheric pressure in Tahiti to that of Darwin, Australia, and is expressed as a standardized deviation from the long-term norm. Strong negative anomalies are associated with an El Niño event (Cane 1986; Rasmusson 1991) and strong positive departures of the SOI are associated with La Niña conditions. Warm ENSO events are exemplified by above-normal SSTs in the Eastern Pacific (EP) and sometimes above-normal SSTs in the Western Indian Ocean (WIO). Warm ENSO events (Fig. 5) are known to increase precipitation in some regions of East Africa and result in droughts in southern Africa (Glantz 1991; Ropelewski and Halpert 1987). Such global scale precipitation anomalies can be inferred from Outgoing Longwave Radiation (OLR: an index of cloudiness) data, for example as shown in the OLR anomalies for December 1997 (Fig. 6).
Correlation of sea surface temperatures and rainfall anomalies illustrate ENSO teleconnection patterns. There is a tendency for above (below) normal rainfall during El Niño (La Niña) events over East Africa (Southern Africa, Southeast Asia). Similar differential anomaly patterns were observed for other regions, especially within the global tropics. These extremes (above or below) in rainfall influence regional ecology and consequently dynamics of mosquito disease vector populations and patterns of mosquito-borne disease outbreaks (Anyamba et al. 2012). Anomalous climatic conditions caused by ENSO are now recognized to be linked with outbreaks of several human and livestock diseases in various countries (Nicholls 1991). The eco-climatic conditions associated with disease outbreaks can now be effectively monitored with satellite-based measurements of key biotic and climatological data. As described above, negative SOI anomalies and above-normal SSTs in the EP and WIO oceans result in above-normal rainfall in East Africa. Vegetation in semi-arid and arid regions responds quickly to rainfall, therefore the rapid vegetation development that follows anomalously high rainfall conditions can be quickly mapped over large areas using satellite data.
For such purposes the normalized difference vegetation index (NDVI) data from the Advanced Very High Resolution Radiometer (AVHRR) on polar-orbiting National Oceanic and Atmospheric Administration (NOAA) satellites can been used to rapidly map and identify regions where conditions are suitable for the development of RVF epizootics. The NDVI is an indicator of the state and seasonality of vegetation (Fig. 8), the primary productivity on the earth that drives the dynamics of most animal populations including those of mosquitoes.
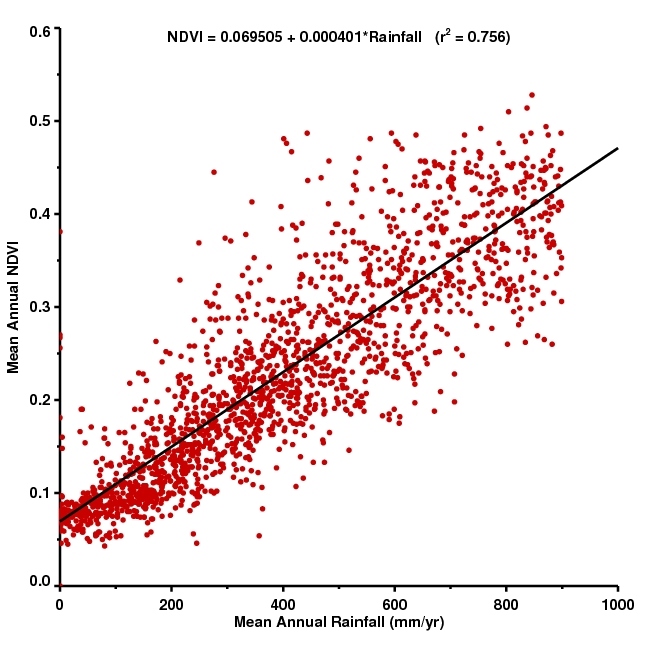
Figure 8. Relationship between mean NDVI and mean annual precipitation for 1980-1997 for reporting stations in sub-Saharan Africa for 0-1200 mm/yr precipitation averaged over years. Each datum corresponds to a specific meteorological station location and the associated satellite data for an area of ~520 km2 centered on the meteorological station in question (adapted from Tucker and Nicholson 1999; updated, Anyamba and Tucker 2012).
Refinement in determining the spatial distribution of RVF viral activity, through identification of ideal mosquito habitat, has been possible using NDVI data derived from higher resolution Landsat, SPOT, and air-borne synthetic aperture radar data (Pope et al. 1992; Linthicum et al. 1994). However, predictive indicators are needed in order to forecast RVF outbreaks. In this series of monthly reports we provide updates and analysis of a combination of several climate indices and satellite vegetation measurements to monitor conditions and map areas that are likely to be hot spots for RVF outbreaks based on recent research results from Linthicum et al. (1999) and Anyamba et al. (2009, 2010).
Similar highly correlated NDVI-precipitation relationships such as the one shown in Fig. 8 exist regionally within Africa, although the functional form(s) may be slightly different. Precipitation and green vegetation dynamics are a major determinant of life cycles of animals and insects in semi-arid lands of Africa. Various research studies indicate a close relationship between the seasonal trace of green vegetation development (NDVI) with breeding and upsurge patterns of particular insect vectors including locusts and mosquitoes (Tucker et al, 1985; Hielkema et al, 1986; Linthicum et al, 1987). Widespread heavy rains result in vegetation development that provides a good environment for immature and adult mosquito vector populations to increase, significantly elevating the risk of RVF outbreaks. The life cycle of mosquitoes that carry and transmit the RVF virus is coupled to such rainfall events, with anomalously massive numbers of RVFV-infected mosquitoes emerging from dambo environments following above-normal rainfall. The close coupling between ENSO, rainfall, NDVI response patterns, and mosquito life cycle dynamics provides the basis for using NDVI time series measurements to map areas at risk from RVF.
Historical Relationships: RVF and Interannual Climate Variability
a. Rift Valley fever and the Southern Oscillation Index
During the 48-year 1951-2011 period, there were eight periods with RVF viral activity and 13 periods with strong negative anomalies in the SOI (less than -1.5) (Fig. 9).
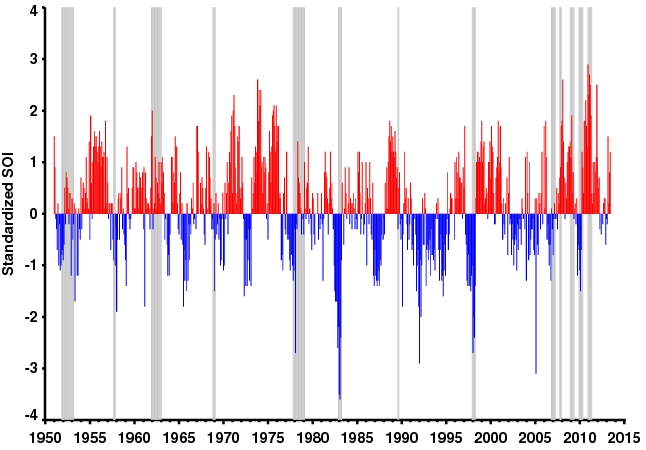
Figure 9. Periods of RVF outbreak events shaded in grey plotted against time and the Southern Oscillation Index (SOI), a measure of the phase of El Niño /Southern Oscillation (ENSO) events. Most RVF outbreak events have occurred during the warm phase of ENSO (i.e., during periods of negative SOI index, shown in blue in East Africa) and during the cold phase in Southern Africa. (Reconstructed after Linthicum et al. 1999, and updated Anyamba 2012).
Exceptionally above-normal rainfall was coincident with major regional RVF epizootics in 1951-1953, 1961-1963, 1968-1969, 1977-1979, 1997-1998, and 2006-2007 (Davis et al. 1985; Linthicum et al. 1999; Anyamba et al. 2009, 2012b).
In late 1957 and 1982, and in the middle of 1989, heavy rainfall in Kenya preceded RVF virus activity that was detected by either identification of clinical cases, isolation of the virus in mosquitoes, or detection of high levels of immune globulin (type IgM) antibody specific for RVF virus (indicating recent RVFV infection) in domestic animals and humans (Davies 1985; Linthicum 1987; Logan et al. 1991). RVF activity and above-normal rainfall have always followed a period of strong negative deviation of the SOI; however, neither the strength nor the length of the SOI anomaly correlated with intensity of RVF activity. The regional RVF activity detected in 1982 followed an intense SOI anomaly of less than -4, while the major outbreaks starting in 1951, 1961 and 1968 occurred after SOI anomalies of less than -2. Strong negative SOI anomalies also occurred in 1964, 1969, 1972-1973, 1981, and 1991-1995; however, there was neither above-normal rainfall nor detectable RVF activity in Kenya/East Africa for these periods. Although excessively heavy rainfall and RVF activity in Kenya was dependent upon a strong SOI anomaly, the overall ability to predict a RVF outbreak using SOI anomalies alone was only 67%, indicating other factors must be involved.
b. Rift Valley fever and Sea Surface Temperatures
A strong relationship between equatorial Pacific SSTs and elevated East African precipitation has been reported (Ropelewski and Halpert 1987, 1989 and by many others). In addition, Indian Ocean SSTs have been reported to be highly correlated to rainfall in East Africa (Nicholson and Kim 1997). Concurrent eastern/equatorial Pacific (EP) and Western Indian Ocean (WIO) SST anomalies greater than 3°C and 0.5°C, respectively, were correlated with widespread rains in East Africa and RVF outbreaks (Linthicum et al, 1999, Anyamba et al 2006, 2009). Historically, RVF activity has followed 2 (1982-1983), 5 (1997-1998), and 4-5 (2006-2007) months of strong concurrent equatorial Pacific and Western Indian Ocean SST anomalies (Fig. 10).
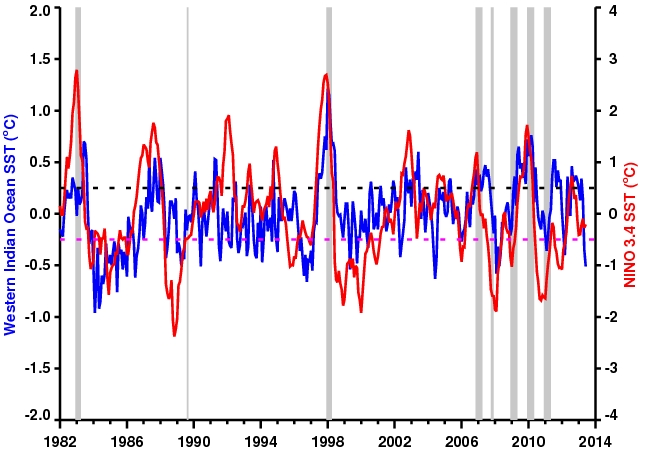
Figure 10. Equatorial Western Indian Oceans (WIO) and NINO3.4 SST anomalies 1982 — 2013. RVF outbreaks periods are shown as grey bars.
When both equatorial Pacific and Indian Ocean SSTs were elevated, the extent of the Indian Ocean temperature anomaly was indicative of the intensity and the duration of RVF activity. However, when the strength of the concurrent Pacific and Indian Ocean SST anomalies is reduced, but still positive, the pattern of increased rainfall can be irregular and a region-wide effect cannot usually be found. As observed with the SOI, the patterns of SSTs on their own are not sufficient to consistently and reliably predict risk of RVF outbreaks, further indicating that other factors must also be involved.
c. Rift Valley fever, Rainfall, and the Normalized Difference Vegetation Index
To overcome the problem of determining where, and to what extent, RVF outbreaks were possible in years lacking concurrently high Pacific and Indian Ocean SST anomalies, we use a normalized difference vegetation index (NDVI) derived from NOAA AVHRR satellite data to identify areas of abnormally high green vegetation development resulting from above-normal rainfall (Anyamba and Eastman 1996; Myneni et al. 1996).This is possible through the use of inter-calibrated satellite NDVI data running from 1981 through the present (Holben et al. 1990; Vermote and Kaufman 1995). Elevated NDVI anomalies, as indicated by dark green colors (Fig. 11) were observed for East Africa for September — December 2006, coincident with above normal rainfall and extending through the normal December-February dry season into March-April 2007. Similar patterns were observed for Sudan (May — October 2007) and Southern Africa (October 2007 — April 2008) (Anyamba et al. 2012). NDVI anomalies were significantly correlated with RVF activity 1 to 2 months before detection of viral activity (p < 0.5) following several months (3-4) of sustained and above-normal rainfall (Fig. 12).
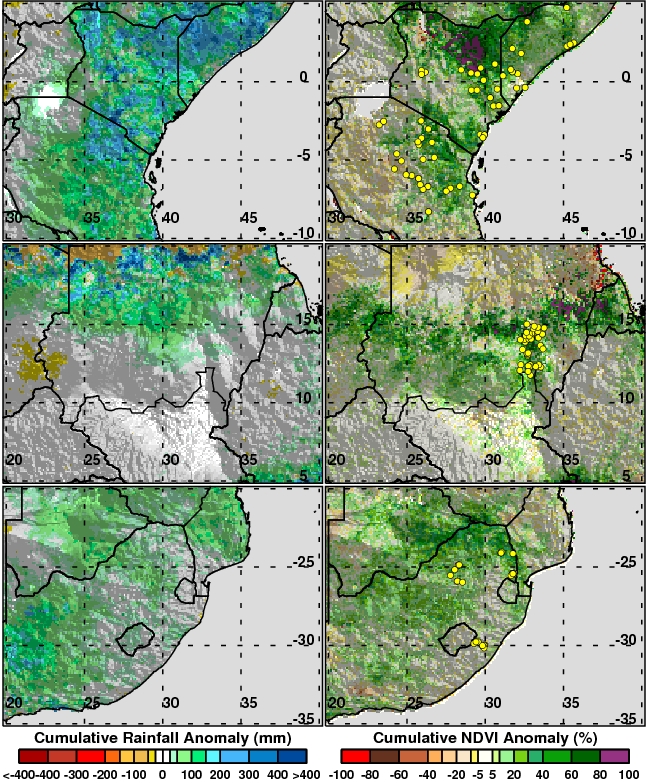
Figure 11. Cumulative rainfall anomalies and vegetation index anomalies for East Africa (2006-2007), Sudan (2007), and Southern Africa (2007-2008) with RVF outbreak locations shown as yellow dots.
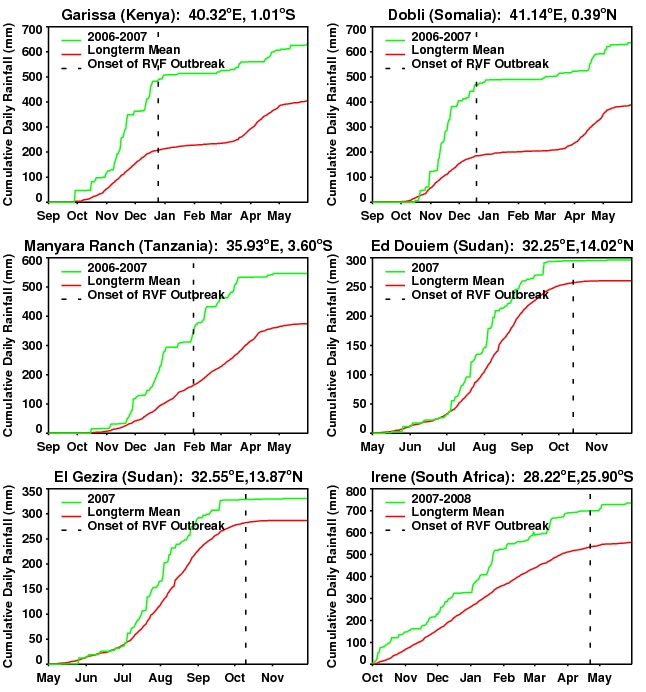
Figure 12. Cumulative daily (green) and long-term mean (red) rainfall profiles for periods of Rift Valley fever activity for selected outbreak locations. Dotted line represents when the first case of Rift Valley fever was identified at each location.
Strong, positive NDVI anomalies were observed in June 1989 with the presence of RVF activity, and observed in January-February 1993 in the absence of detectable RVF activity. We suggest that the elevated NDVI values at these times reflected local rain conditions because they were not observed in NDVI anomaly data for the same period at other locations in Kenya.
3. Risk Monitoring, Mapping, and Prediction Model
We have developed a monitoring and risk mapping system that utilizes the NDVI as a proxy for ecological dynamics to map areas at potential risk of Rift Valley fever. This is based on our findings that NDVI is a complex proxy representing the interaction of several variables, including rainfall, temperature, and soil moisture that are important for the emergence, survival, and propagation of Rift Valley fever mosquito vectors. Using this approach we successfully retrospectively predicted areas where Rift Valley fever outbreaks occurred between 1981-1998 (Anyamba et al. 2002) and subsequently predicted areas of recent Rift Valley fever outbreaks in East Africa in 2006-2007, Sudan 2007, and Southern Africa 2008-2010 (Anyamba et al. 2009, 2010). The structure of this system is outlined in Fig. 13 and the risk map and accuracy assessment for the 2006-2007 outbreak in East Africa is shown in Fig. 14.
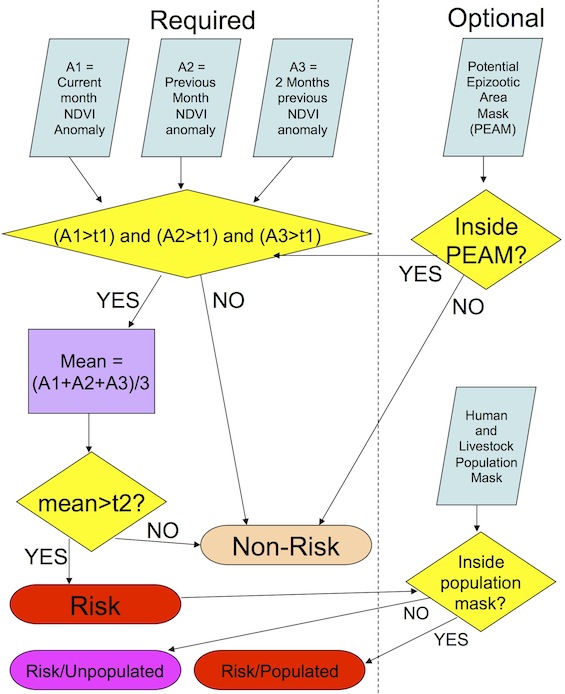
Figure 13. Flow chart representation of the Rift Valley fever monitoring and risk mapping model (based on Anyamba et al. 2002 and updated)
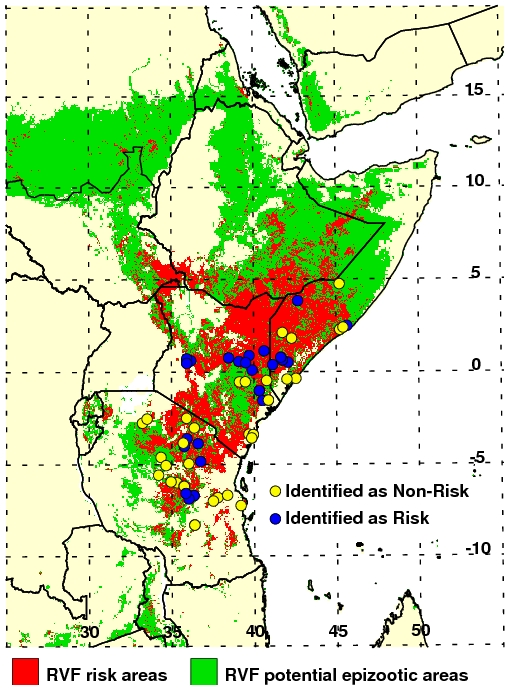
Figure 14. Output of the Rift Valley fever risk analysis model with outbreak location validation data overlay.
- Mapping of potential epizootic areas — based on literature surveys and thresholding of climate variables (rainfall and long-term NDVI) to create a static mapping of the potential epizootic area mask (PEAM; Anyamba et al. 2009; C. J. Peters & K.J. Linthicum in Handbook of Zoonoses). The risk map and the PEAM mask are mapped match the spatial resolution of the long term NDVI data as 8km spatial resolution.
- Identification of risk areas is determined from NDVI anomaly calculations, taking into consideration the persistence of positive anomalies above a threshold of 0.025 NDVI units (based upon a desert calibration) over a 3 month period. The model thus captures these temporal dynamics in ecology using time series measurements of NDVI as:
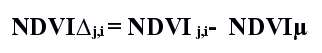
 are monthly values during year i and month j, and
  are the long-term monthly means, respectively. Areas must have positive anomalies above the noise level (i.e., greater than 0.025 NDVI units) for three consecutive months. Expressed as anomalies, NDVI values over the desert areas fluctuate between plus and minus 0.025; therefore, any variation greater or less than these values is considered of real significance to ecological dynamics: i.e.,
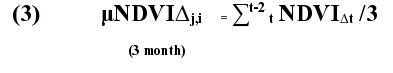
Persistently positive anomalies must have a three-month mean NDVI anomaly exceeding a threshold of 0.1 NDVI units: i.e.,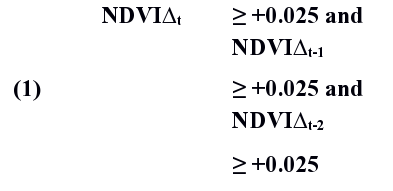
where the average NDVI anomaly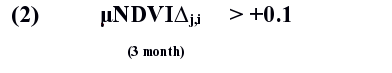
 over the last three months (i.e., t, t - 1, t - 2; that is, current and two previous months): i.e.,
- To derive areas at risk for RVF outbreaks the model takes into consideration the following factors: (1) mapping of epizootic/epidemic regions as informed by areas of reported historical outbreaks combined with thresholding of long-term NDVI and rainfall to identify areas with a high inter-annual variability signal to create a potential epizootic area mask/map (PEAM), and (2) temporal dynamics of mosquito vector populations in dambo habitats, as measured empirically (Fig. 3).
- The model is then run with inputs of NDVI anomalies to detect areas with persistent positive NDVI anomalies (greater than +0.1 NDVI units) using a 3-month moving window [equations 1, 2 above] to flag regions at greatest risk that are located in (1) above (i.e., in the potential epizootic area mask) and, in the currently revised model, those risk areas that fall in areas with livestock and human population. The system is designed to account for periods of extended above-normal NDVI (and, by inference, rainfall) and to consider the complex life cycle of mosquitoes that maintain and transmit RVFV to domestic animals and people.
- All 8 km x 8 km grid cells of the risk map area that meet this criteria, are within the PEAM, and are within human and livestock population areas are mapped to (red color) where there are human and livestock populations present, low risk (purple color) where livestock and human populations are absent or unflagged (green PEAM color). The current model does not yet estimate gradients of risk within the PEAM.
4. RVF and All Climate Indicators
To determine the best predictors of RVF activity we evaluated SOI, equatorial Pacific SST, Indian Ocean SST, and NDVI anomalies in various combinations in autoregressive integrated moving average (ARIMA) models. The best fit to the RVF outbreak data was achieved when equatorial Pacific and Indian Ocean SST, and NDVI anomaly data were used together (ARIMA, SBC = -106, ANOVA df = 192, p < 0.01). These data could have been used to successfully predict each of the three RVF outbreaks that occurred between 1982 and 1998 without predicting any false RVF events for an overall prediction of risk of 100%. Predictive models utilizing either SOI and Indian Ocean, or NDVI and Indian Ocean anomaly data would have predicted all 3 RVF events but falsely predicted either one or two disease events, respectively.
We suggest that NOAA AVHRR NDVI time-series data are required to identify more localized areas where anomalous rainfall has occurred and hence where more localized RVF activity is present. It is only by carrying out this discrimination that lower levels of RVF can be confirmed, or conversely, that a lower threshold of rainfall anomalies coupled with extent of affected area determined, as this relates to RVF activity outbreaks. The satellite-based NDVI data are available the same day as acquisition, provide confirmation of predicted rainfall events using SSTs, and provide direct identification of localized rainfall anomalies.
The ability to forecast regional RVF virus activity in Kenya, based upon Pacific and Indian Ocean SST anomalies, and NDVI 2-5 months before outbreaks could permit vaccination of domestic animals, distribution of information and preventive strategies to affected populations, and pretreatment of mosquito habitats adjacent to domestic animal herds and human habitations with highly effective sustained release insecticides that would be released upon flooding (Logan et al. 1990; Anyamba et al. 2010).
