This section of the report will provide a rolling three month update on a monthly basis of the state of the climatic and ecological indicators used in monitoring areas at risk to RVF activity. These indicators include, global SST anomalies patterns, Equatorial Western Indian Ocean (WIO) and Eastern Pacific Ocean (EPO: NINO 3.4) SST anomalies, Southern Oscillation Index (SOI) and Outgoing Longwave Radiation (OLR) anomalies, Rainfall and anomalies, Normalized Difference Vegetation index anomalies and RVF risk map for Africa and the Arabian Peninsula.
May 2019
1. SOI and SST Indices


The SOI shifted back to negative values from 0.1 in April to -0.4 in May continuing the month-to-month variability observed in the last several months. The oceanic indices in the eastern equatorial Pacific have weakened a little bit but remain positive: NINO1&2 at 0.16, NINO3 at 0.61, NINO 3.4 at 0.71 and NINO4 at 0.77. The western Indian Ocean SST index has further increased to 0.61 from 0.3 in April indicting a continued infusion of warm water from the southern Indian Ocean. Overall, all the monitoring indices indicate continuing weak warm ENSO conditions prevailing at the moment. Current NOAA CPC forecasts indicate that weak El Niño conditions are likely to continue through the Northern Hemisphere summer (66% chance) and persist in the fall (50-55% chance).
Global SST and OLR Anomalies
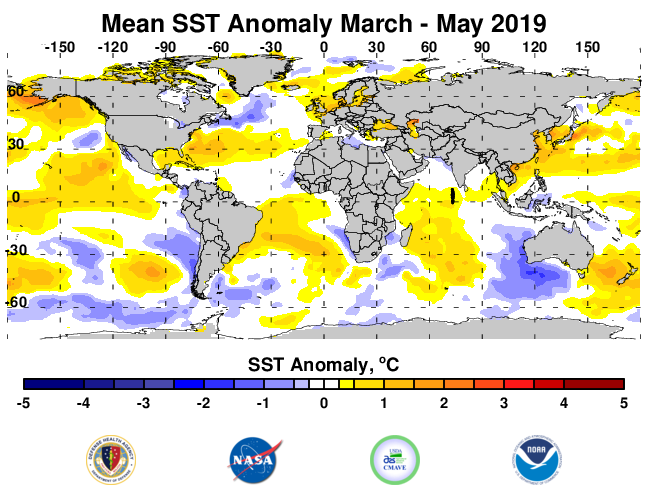

The March - May 2019 seasonal SST anomalies show a similar pattern to the previous season with warmer than normal conditions the equatorial Pacific Ocean with seasonal temperatures approximately 1.5°C above normal along the equator concentrated in the central -eastern equatorial Pacific American coast and extending towards North America. However, the region to the immediate south - off coastal Chile has continuing area of negative SSTs. Western equatorial Indian Ocean temperatures are above normal extending to the main anomaly in southern Indian Ocean east of Madagascar at 2.0°C. Monthly and weekly SST anomalies can be found here.
Outgoing Longwave Radiation (OLR) anomalies are used here as a proxy for tropical deep convection (rainfall). Reduced convection is shown in yellow to light brown and brown shades and increased/intense convection is shown by shades of blue. The March - May 2019 OLR anomalies shows some characteristic evidence of warm ENSO teleconnections with drier than average conditions throughout the western equatorial Pacific and evidence of convection activity in the central equatorial Pacific just east of the dateline. The western equatorial Pacific Ocean particularly the Indonesian Basin extending westwards into across the Indian Ocean has reduced convection with positive OLR anomalies (+55W/M*2) and areas surrounding this region are drier than normal. In the higher latitudes drier than normal conditions continue to persist across Western Europe into central Russia. Most of northern Brazil - Central America, interior Southern Africa and East Africa also show pronounced dry conditions. Globally, most of the intense convective activity is centered over continental US over the last three months (- 55W/M*2).
2. Seasonal Rainfall and Cumulative Rainfall Anomalies
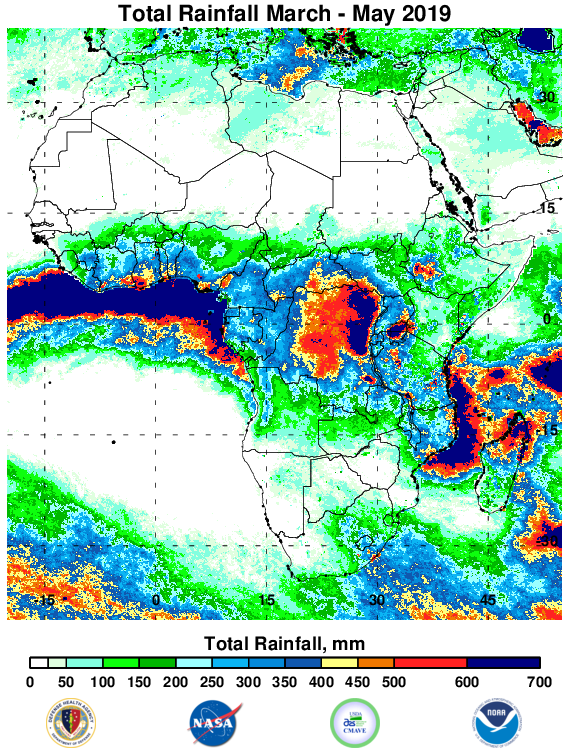

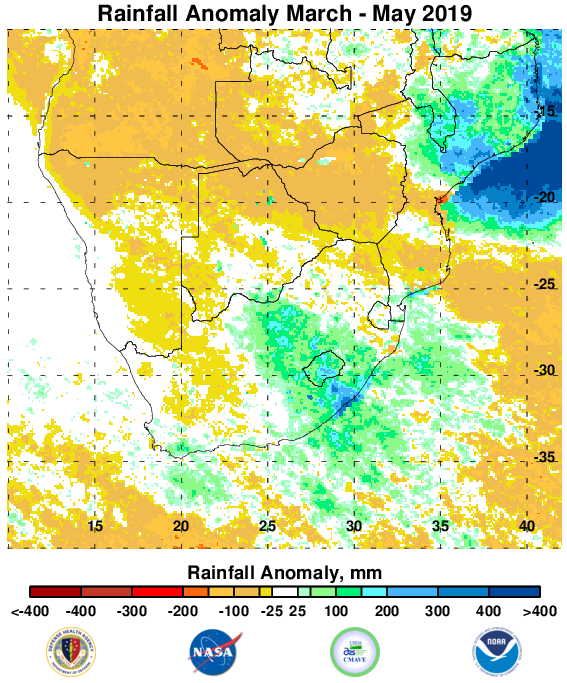
The majority of rainfall over Africa from March - May 2019 is now concentrated of the within the equatorial zone between 10S and 15N, with maximum totals of 700mm from the along the equator from West Africa, through the Congo basin towards eastern Africa. Seasonal totals were near normal over most of the continent. Maximum above normal rainfall is observed over the southeastern Congo basin, Tanzania, northern Mozambique with totals as high as 300mm above normal over the three-month period for cyclone hit areas of Mozambique. Areas of rainfall deficit persist in Gabon, SE Cameroon, western Congo, and East Africa and over countries of southwestern Africa region.
3. NDVI Anomalies and RVF Risk Map
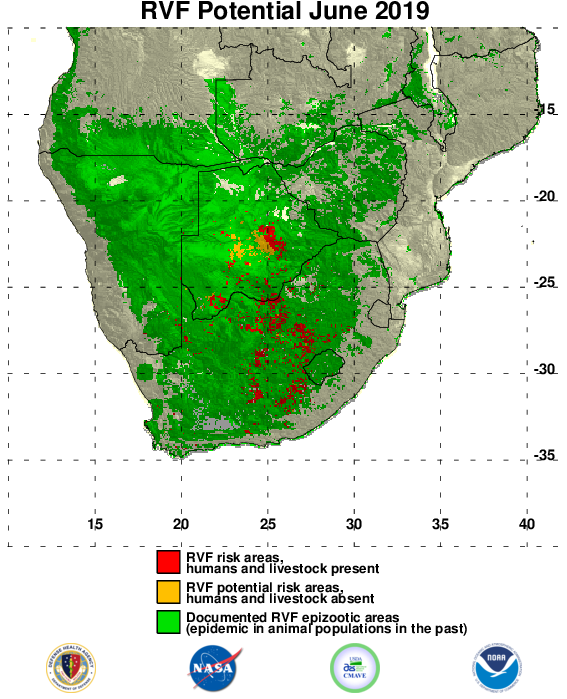
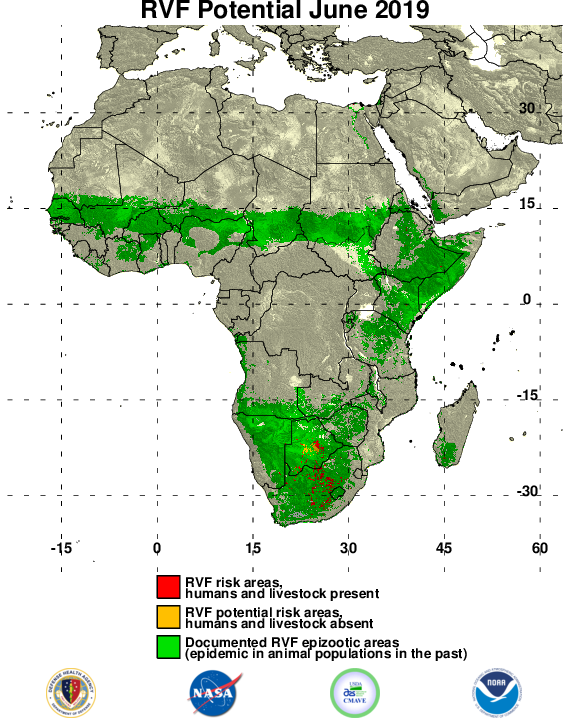
March - May 2019 NDVI anomalies for Africa show that most of continent has diminished vegetation conditions except for a few isolated areas in northwestern Africa, parts of the Sahel, central Botswana and parts of central South Africa with positive anomalies on the order of ~+40%. The RVF risk map in this report was derived from thresholding NDVI anomaly data to detect areas persistent of above normal NDVI. Periods of widespread and prolonged heavy rainfall lead to flooding of dambos and anomalous green up in vegetation, creating ideal ecological conditions for the emergence of RVF vectors. During March - May 2019, the RVF persistence model identifies areas of risk projected for June 2019 with the isolated risk areas over central South Africa and central Botswana. However, since this is the end of the growing season in this area, this can be considered to be residual risk and doesn’t warrant surveillance.

4. Region of Focus: East Africa/Southern Africa

